

Every mailing loses a few readers. That is not a problem in itself: people change jobs, finish a purchase or simply get fewer emails than they used to. The unsubscribe rate becomes useful when you read it as a signal. A steady rate tells you something about your audience. A sudden rise on one send tells you something about that send.
This guide explains how to calculate the unsubscribe rate, what a normal rate looks like and how to find out why it moved.
What is an email unsubscribe rate?
The email unsubscribe rate, also called the opt-out rate, is the share of recipients who opted out of your emails after receiving a mailing. It is one of the core email marketing KPIs, next to open rate, click-through rate and bounce rate.
On its own, the number says little. Compared over time, across campaigns and between segments, it shows whether your content, frequency and audience still fit each other.
Unsubscribe rate formula: how to calculate it
The usual unsubscribe rate formula is:
Example: a mailing delivered to 1,000 addresses with 5 unsubscribes gives 5 ÷ 1,000 × 100 = 0.5%.
Three choices change the result, so decide them once and keep them consistent:
| Choice | Use | Why |
|---|---|---|
| Denominator | Delivered emails, not sent emails | Bounced addresses never had the chance to unsubscribe. |
| Count | Unique unsubscribes per mailing | One person clicking the link twice is still one unsubscribe. |
| Period | Per send for a campaign, per week or month for your program | Mixing the two in one report makes the numbers incomparable. |
Email platforms do not all count the same way. Some attribute an unsubscribe to the mailing that contained the link, others to the day it happened. Check how yours does it before you compare numbers from different platforms.
What is a good unsubscribe rate?
Mailchimp’s email marketing benchmarks put the average unsubscribe rate across its users at 0.22% per campaign, with industry averages such as 0.15% for business and finance and 0.19% for ecommerce (updated December 2023). Averages differ by industry, list size and how the list was built, so treat an average unsubscribe rate as a rough reference, not a target.
At the other end, HubSpot suspends marketing email for accounts whose unsubscribe rate reaches 3% in a month. That is the point where a platform sees a problem, not a level to aim for.
Your own history is the better benchmark. Compare a mailing with similar mailings to the same audience: same type, same segment, similar timing. A newsletter and a promotional campaign often have very different rates, and both can be normal.
When a rise is healthy and when it is a problem
Not every unsubscribe is a loss. A rise needs attention when it is concentrated: one campaign, one segment, one template or one market that behaves differently from the rest.
| Usually healthy | Worth investigating |
|---|---|
| A rise after a large import or a new signup source, as uninterested people leave | One campaign with a much higher rate than similar campaigns |
| Customers leaving after a one-off purchase they no longer need emails about | One segment, market or language that rises while the others stay flat |
| The least engaged readers opting out after you deliberately send more often | A rise across all mailings after a change in template, sender name or content type |
How to investigate a rise in unsubscribes
Start by finding where the change happened before deciding why.
- One send or all of them? If one mailing stands out, look at its subject line, content, offer and audience. If the rate rose across the board, look at frequency, list source or a change in design.
- Which segment? Compare new and established subscribers, buyers and non-buyers, or markets and languages. A rise among new subscribers points to expectations set at signup.
- What changed? Check whether frequency, template, sender name or content type changed around the same time.
- Is it unusual? Compare with the same type of mailing in previous weeks before acting on a single result.
Example: the Van Gogh Museum
The Van Gogh Museum used this kind of comparison. Its international newsletters were generating relatively many unsubscribes, which prompted a closer look at how relevant the content was. After the team introduced a more editorial newsletter format, the unsubscribe rate was approximately 23% lower in the comparison it shared. The team describes this as a promising early result. Read the Van Gogh Museum story.
How to reduce your unsubscribe rate
Confirm new subscribers with double opt-in
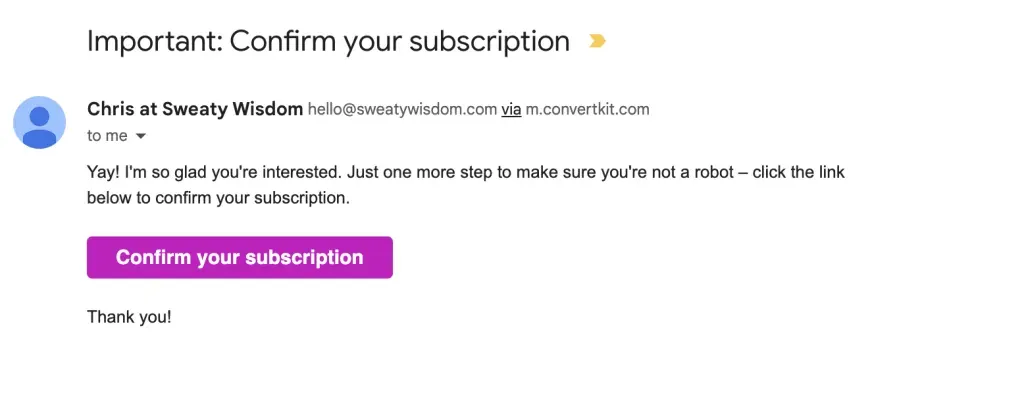
Double opt-in asks new subscribers to confirm their address before they join your list. People who sign up by accident or with a mistyped address never reach it, and the people who do confirm have shown real interest. Most email platforms can automate this.
Be careful with gated content and signup incentives. Many people subscribe to get the download and leave soon after.
Set expectations and keep them
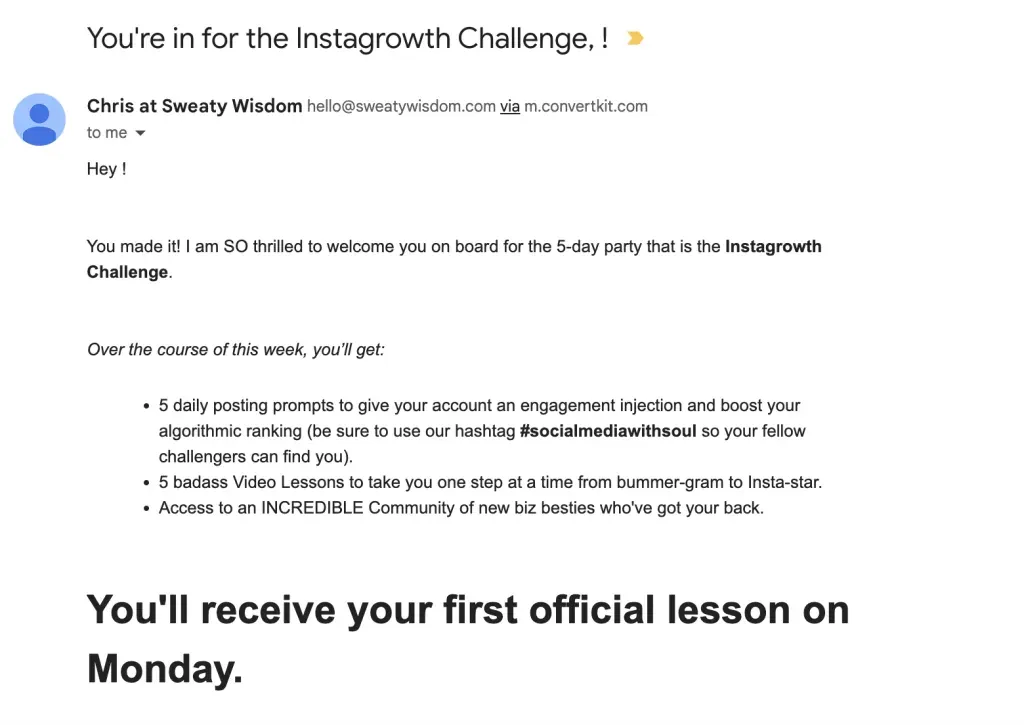
A welcome email can tell new subscribers what they will receive and how often. If you promise a weekly newsletter, send a weekly newsletter. Long silences are a risk too: people who have not heard from you for months may no longer remember why they signed up.
Send relevant content to the right people
Relevance matters more than volume. Divide your audience into segments in your email platform and send each group what fits it. A preference center lets subscribers choose topics or frequency themselves, which gives them an option between staying and leaving.
Watch your frequency
Sending more often can raise revenue and unsubscribes at the same time. Change frequency in steps and compare the unsubscribe rate and engagement per segment before and after.
Make emails easy to read
Use templates that work on every screen, a clear layout, readable fonts and short paragraphs. Emails that load slowly or break on mobile frustrate readers.
Make unsubscribing easy
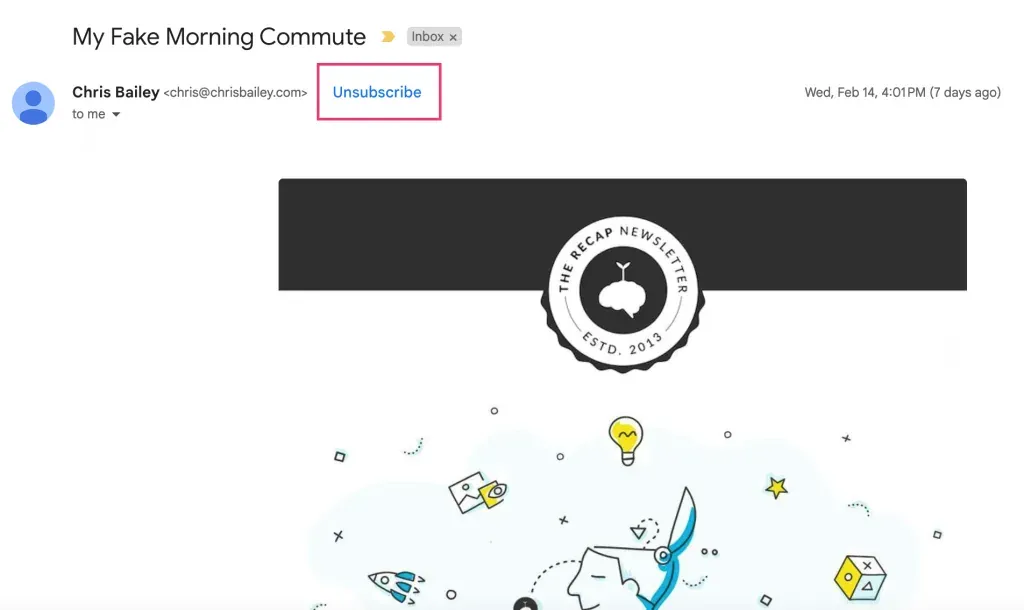
A hidden unsubscribe link does not keep people on your list. It turns them into spam complaints, which hurt your deliverability more than an unsubscribe does.
Since February 2024, Google and Yahoo require bulk senders to support one-click unsubscribe. In practice, that means adding these two headers to your marketing emails:
List-Unsubscribe: <https://example.com/unsubscribe/opaque-token>
List-Unsubscribe-Post: List-Unsubscribe=One-Click
The first gives mailbox providers the address to call; the second tells them a single request is enough to unsubscribe.
See Google’s email sender guidelines for the full requirements. Most email platforms add these headers for you.
Ask for feedback
Ask subscribers which topics they want and how often they want to hear from you. An optional question on the unsubscribe page also tells you why people leave.
How SEINō helps
SEINō sits on top of your email platform and web analytics. In SEINō you can compare unsubscribe rates across campaigns, segments and markets without building a new report for every question. Segments come from your email platform; SEINō shows how each group performs.
You can also set an alert on the unsubscribe rate, either against a fixed threshold or against its normal pattern, so a rise is flagged when SEINō checks your data, a few times a day.
Email unsubscribe rate: FAQ
How do I calculate the email unsubscribe rate? Divide the number of unique unsubscribes by the number of delivered emails and multiply by 100.
Why is my unsubscribe rate so high? Common causes are content that no longer fits the audience, a change in frequency, a new list source or expectations that were not set at signup. Find where the rise is concentrated first.
Does the unsubscribe rate affect deliverability? Unsubscribes themselves are a normal part of email. Spam complaints do more damage, and a hard-to-find unsubscribe link makes complaints more likely.
Should I remove inactive subscribers? Remove addresses that are permanently undeliverable. For inactive readers, try a re-engagement message first; some people return after months without opening.